
Author: Wonduk Seo, Daye Kang, Hyunjin An, Taehan Kim, Soohyuk Cho, Seungyong Lee, Minhyeong Yu, Jian Park, Yi Bu, Seunghyun Lee
Enhans, Enhans, Kaist, UC Berkeley, Princeton University, Fudan University, Peking University
Accepted by International Conference on Pattern Recognition (ICPR)
TL;DR
1. The paper introduces VisPath, a multi-path reasoning and feedback-driven framework that turns text-to-visualization code generation into a search over diverse candidate reasoning paths plus visual evaluation, rather than a single-shot prompt-to-code pipeline.
2. VisPath operates in three stages: (i) a Multi-Path Agent generates diverse reasoning paths from the user query and dataset description, (ii) a Code Generation agent turns each path into executable visualization code, and (iii)a Feedback +Integration stage uses a vision-language model (VLM) to evaluate rendered plots and synthesize a final, optimized script.
3. On MatPlotBench and the Qwen-Agent Code Interpreter Visualization benchmark,VisPath consistently outperforms strong baselines such as Zero-Shot prompting,CoT prompting, Chat2VIS, and MatPlotAgent, achieving up to +9.14 Plot Score and+10 percentage points Executable Rate improvements across GPT-4o mini and Gemini 2.0 Flash.
4. Ablation and cost analyses show that a small number of reasoning paths (K=3)and structured visual feedback provide the best trade-off between quality and efficiency.
5. VisPath offers a practical path to robust, explainable, and production-ready visualization generation for business dashboards, analytical reporting,optimization monitoring, that can handle ambiguous or under specified natural language requests.
Abstract
Large Language Models (LLMs) have become a cornerstone for automated visualization code generation, enabling users to create charts through natural language instructions. Despite improvements from techniques like few-shot prompting and query expansion, existing methods often fail to handle ambiguous or complex queries effectively, frequently necessitating manual intervention. To overcome these limitations, we propose VisPath: a Multi-Path Reasoning and Feedback-Driven Optimization Framework for Visualization Code Generation. VisPath handles under specified queries through structured,multi-stage processing. It begins by using Chain-of-Thought (CoT)prompting to reformulate the initial user input, generating multiple extended queries in parallel to capture diverse interpretations of user intent. These queries then generate candidate visualization scripts, which are executed to produce diverse images. By assessing the visual quality and correctness of each output, VisPath generates targeted feedback that is aggregated to synthesize an optimal final result. Extensive experiments on widely-used benchmarks including MatPlotBench and the Qwen-Agent Code Interpreter Benchmark demonstrate that VisPath outperforms state-of-the-art methods, offering a more reliable solution for AI-driven visualization code generation.
Introduction
The paper starts from a practical painpoint: visualization is essential, but writing visualization code is not.Analysts,scientists, and business users need plots to explore patterns, monitor KPIs,and explain model behavior, but getting from “what I want to see” to“correct Matplotlib/Seaborn code” remains labor-intensive. LLM-based systems promise a shortcut: type a natural language request, get ready-to-run code.
However, current approaches typically follow a single reasoning trajectory. They map one query to one code snippet,sometimes with CoT or prompt templates, but they do not systematically explore alternative interpretations. This breaks down in exactly the situations that are common in real life:
• Ambiguous instructions(“show trends overtime for key metrics”)
• Under specified visual design choices(axes, aggregation, multi-series composition)
• Complex combinations(“visualize this inthree different ways”)
Template-based systems (e.g.,prefix-guided) are easy to control but inflexible; iterative self-debugging frameworks fix syntax and runtime errors but still cling to a single semantic path. The result is code that often runs but is semantically misaligned,requiring human edits—undermining the whole point of automation.
VisPath takes a different stance: don’t commit to one interpretation too early. Instead, treat visualization generation as a process of: (1) Exploring multiple plausible reasoning paths, (2) Turning each into candidate code and visual output, and (3) Using visual feedback tos ynthesize the best final answer.
Datasets and Methods
Datasets
VisPathis evaluated on two text-to-visualization benchmarks:
l MatPlotBench
• ~100 items with paired ground-truth images.
• Focus on a simple instruction subset that still includes nuanced visualization tasks(e.g., specific styling,layout, or aggregation).
• Evaluated by similarity to ground truth and executability of generated code.
l Qwen-Agent Code Interpreter Benchmark(Visualization subset)
• 295 records in total, with 163 visualization-related examples.
• Tasks cover math, data visualization, and file operations.
• For visualization, evaluation is based on code correctness and execution results(Visual-Hard / Visual-Easy).
These two datasets together stress: Image similarity +aesthetic correctness (MatPlotBench), and Executable and logically correct code under a more general code-interpreter setting (Qwen).
Models and Evaluation Setup
LLMs for Code Generation & Reasoning
l Code inference models:
• GPT-4o mini
• Gemini 2.0 Flash
l Used to:
• Expand queries into multiple reasoning paths.
• Generate visualization code from each reasoning path.
l Temperature set to 0.2 for stable,focused outputs (following prior work).
Vision-Language Models (VLMs) for Feedback
l GPT-4o (and Gemini 2.0 Flash for feedback in some settings) is used as a visual evaluation model,inspecting either the rendered plot image or error messages plus code.
l Feedback is structured,covering:
• Alignment with the query,
• Plot layout and clarity,
• Data–visual mapping correctness,
• Suggestions for improvement.
Metrics
l MatPlotBench:
• Plot Score (0–100): similarity to the reference plot.
• Executable Rate (%): fraction of code snippets that run without errors.
l Qwen-Agent Visualization:
• Visualization-Hard / Visualization-Easy /Average:
• Code correctness metrics derived from execution results and expected outcomes.
Baselines
All baselines are evaluated under the same LLM backbone for fair comparison:
1. Zero-Shot
• Directly generate visualization code from the user query.
2. CoTPrompting
• Single-chain reasoning followed by code generation.
3. Chat2VIS
• Uses prefix-based guidance templates to structure code generation and mitigate ambiguity.
4. MatPlotAgent
• Performs query expansion and iterative self-debugging using feedback from a VLM; limited to three iterations for parity.
VisPath Configuration
l K = 3 reasoning paths by default.
l Each path yields one candidate visualization script and one evaluation round of visual feedback. Prompts for all agents are standardized and detailed in the appendix (not included here).
Framework: VisPath
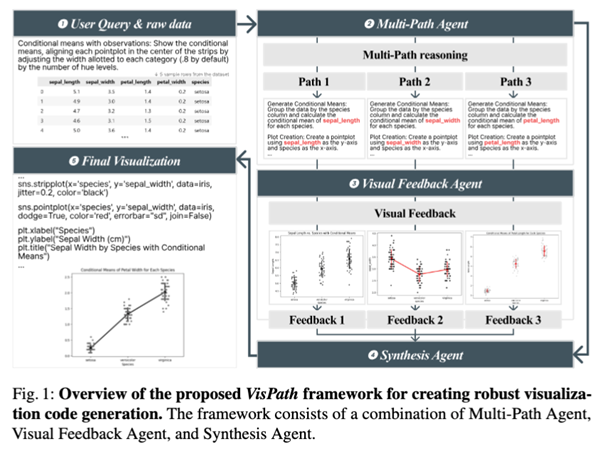
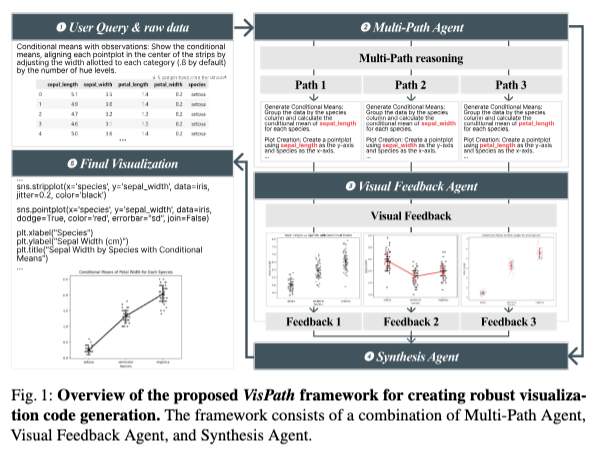
Core idea: “Explore multiple interpretations → generate multiple codes → use visual feedback to integrate into one final script.” VisPath is implemented as a three-stage pipeline:
1. Multi-Path Query Expansion
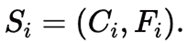
Input: User query Q and dataset description D.
A Multi-Path Agent (LLM) generates 𝐾 K distinct reasoning paths:
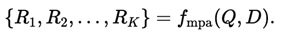
Each Ri is a structured “blueprint”specifying:
• Which variables to plot,
• Aggregation logic,
• Chart type and layout,
• Key design decisions (e.g., color encoding, grouping).
The goal is diversity, not volume:multiple, genuinely different plausible interpretations of the same request,anchored by the dataset description D.
2. Code Generation and Execution
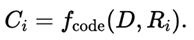
For each reasoning path Ri:
• A Code Generation LLM produces a Python visualization script:
The script is executed:
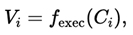
yielding either:
• A rendered plot image, or
• A runtime error.
Executability is captured via:
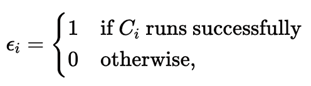
and the routed output Zi is defined as:
• If ϵi = 1: the plot image.
• If ϵi = 0: the error message and context.
This stage generates a set of candidate triplets (Ci,Zi, ϵi)
3. Feedback-Driven Integration
• A Feedback Model (VLM) evaluates each candidate:
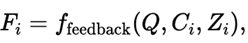
producing structured feedback on semantic and visual quality.
• Each candidate is summarized as:
An Integration Module then synthesizes the final code:
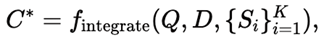
aggregating strengths across candidates and correcting weaknesses identified by feedback.
The result C∗ is a single, executable script that is both semantically aligned with the original query and visually robust.
Experimental Results
Main Results
VisPath is compared against Zero-Shot, CoTPrompting,Chat2VIS, and MatPlotAgent on both MatPlotBench and the Qwen-Agent Visualization benchmark, using GPT-4o mini and Gemini 2.0 Flash as backbones.
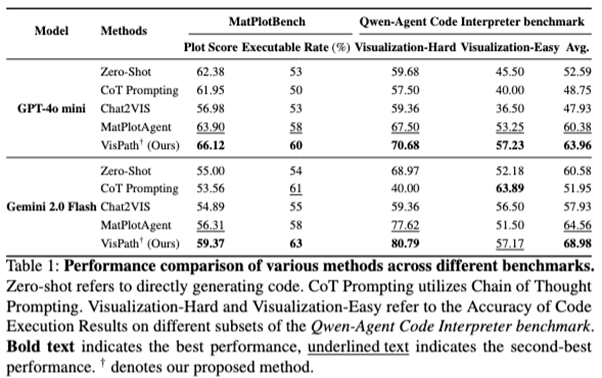
Overall, across all settings, VisPath delivers up to +9.14 Plot Score and +10 percentage points Executable Rateimprovements over weaker baselines, and consistently surpasses MatPlotAgent,especially on harder visualization cases (e.g., polar plots, multi-subplot layouts, compositional views).
Conclusion
VisPath reframes visualization code generation as a multi-path reasoning + feedback integration problem rather thana single-shot prompt-to-code mapping. By:
• Generating diverse reasoning paths from the same user query and dataset,
• Translating each into executable visualization code, and
• Leveraging visual feedback to synthesize a final script,
VisPath achieves higher plot quality,better executability, and improved robustness to ambiguity compared to existingLLM-based baselines. For environments’ business analysis, reporting, and optimization pipelines, VisPath offers a principled way to (1) safely handle vague or high-level analytical prompts, (2) Produce reliable, auditable visualization code, and (3) Maintain a structured, extensible pipeline where future agents (e.g., style constraints, accessibility checks, domain-specific chart policies) can be plugged into the same multi-path, feedback-driven architecture.
in solving your problems with Enhans!
We'll contact you shortly!